About Somwrita Sarkar

Exploring Science of Cities, Urban Data Science, Cities as Complex Systems, Networks.

City size and inequality (again)

Sydney Morning Herald, Thursday, November 17, 2016, pages from 1

Our paper relating inequality and city size in Australia was accepted to Environment and Planning B. It got quite a lot of media coverage: Sydney University did a media release, with reports in Sydney Morning Herald, news.com.au (once), news.com.au (twice), The Australian, Gold Coast Bulletin, Daily Telegraph, West Australian, Courier Mail, Herald Sun, NT News, SBS, to name a few. I also did short but very stimulating (to me) interviews with Robbie Buck and Wendy Harmer on ABC Radio, and talked to the wonderful people who called in. And I kept receiving emails and calls from around Australia, with various organizations asking not only for data and reflections on the analysis we did and our main findings, but also critical and fundamental reflections and discussions on the topic itself.

We were surprised. As we wrote the paper, and went through the peer-review stage, responding to the comments written by anonymous referees, and strengthening the structure of the paper, we did grow in our understanding that the relationship between city size and economic inequality is an extremely deep and extremely important topic. And we looked at this paper as our first step at exploring this question, and thought of a longer term research plan to follow up on the topic. However, what was surprising is the way in which the media and the people related to a piece of analytical, number-filled, model-based academic research – clearly it had tapped some raw nerve. Clearly, from academic research and our books, to everyday conversations, inequality is now taking centre-stage with people. And it is because it is affecting the everyday lives of people. When a piece of research says: bigger cities show accumulation of highest income earners, to the (statistically) common person on the street, this means an immediately reflection on the stark contrast between their low pay, high rents and long travel hours to the CBD each day and the high pay, the harbour side apartment, and walk-to-work for their companion citizen who was simply born on the other side of Sydney. There are two worlds within the same city.

The experience was humbling, because it brought out most clearly as to how beyond talk, beyond analytics, beyond model building, policy at all levels must target these inequalities, and how academic research has a responsibility to not just create knowledge, but the means and mechanisms that can actually bring a change to the everyday lived experiences of the city, as to how we must strive to create cities for everyone and not just the few. I find the words of Calvino forever inspiring: “The inferno of the living is not something that will be; if there is one, it is what is already here, the inferno where we live every day, that we form by being together. There are two ways to escape suffering it. The first is easy for many: accept the inferno and become such a part of it that you can no longer see it. The second is risky and demands constant vigilance and apprehension: seek and learn to recognize who and what, in the midst of inferno, are not inferno, then make them endure, give them space.

The spatial patterns of building approvals

Which areas of Sydney and NSW are recording the highest number of building approvals?

Usually, a trend analysis and volume analysis is performed, analysing the numbers of new dwellings being approved over time. However, a spatial trend analysis is essential too, since understanding the spatial patterns will reveal “where” and “how” the volume of new approvals is organized or dispersed in space. Is there a spatial or spatio-temporal pattern to building approvals? And how can future city boundaries be predicted using approvals as a leading indicator (we talked about the problem of identifying city boundaries a few weeks ago)?

Interactive maps showing Total Dwellings, New Houses, and Other Residential Dwellings, July 2016, Building Approvals, ABS Cat No. 8731.0. In 2015-2016, a clear south-west and north-west spatial pattern is visible. Also visible are differences between new detached houses approvals, that are spread over the region around Sydney, versus other residential buildings, including apartments, townhouses, villas or strata based new approvals, that are concentrated in the Sydney metro regions.

Total Dwellings

https://ssarkar.carto.com/viz/9ec5a9ea-7c89-11e6-90f4-0e3ebc282e83/public_map

New Houses

https://ssarkar.carto.com/viz/3852ebb8-7c8a-11e6-a3f1-0e233c30368f/public_map

Other residential buildings

https://ssarkar.carto.com/viz/172b4c94-7c8c-11e6-8f34-0e3ff518bd15/public_map

Musing on city definitions: Australia

I spent a few summer weeks at CASA, UCL, who very kindly hosted me. There was a lot of interesting discussion on “how to define cities”, and how statistical observations, inferences, analyses, and results could change or vary as the underlying city definitions are varied. At the recent symposium on Cities as Complex Systems, in Hannover, Germany, (where I presented some of our inequality results), this was also recurring topic of discussion. So, back to Sydney, I was thinking about how we define “cities” or “urban areas” in Australia.

So, back to Sydney, I was thinking about how we define “cities” or “urban areas” in Australia, and whether alternative definitions are possible or feasible, and whether our statistical and geographic analysis should be performed at various city definition levels before any conclusions are finalized. For example, here is an example of such analysis for the UK.

The Australian Bureau of Statistics (ABS) defines the statistical geography of Australia at four levels: Statistical Areas Levels 1 (smallest), 2, 3, and 4 (largest), each higher level built on aggregations of the level lower, and each based on rough criteria of social and economic connectedness and population cut-offs. At each level, these cover the whole of Australia, without gaps or overlaps. The detailed description is available here. Significant Urban Areas (SUAs) are then defined by “concentrations of urban development with populations of 10,000 people or more using whole Statistical Areas Level 2 (SA2s). They do not necessarily represent a single Urban Centre, as they can represent a cluster of related Urban Centres with a core urban population over 10,000. They can also include related peri-urban and satellite development and the area into which the urban development is likely to expand”. Here is an interactive map with the SUA boundaries and their  2011 Census populations, for the whole of Australia.

https://ssarkar.carto.com/viz/2ee7e57e-7c6c-11e6-ae36-0ecd1babdde5/public_map

The above definition seems reasonable enough, and at least, is a functional definition (as opposed to an administrative definition [e.g. suburbs, Local Government Areas (LGAs)]. However, even with this definition, the answer to “what is a city or a connected urban system/entity” may not be obvious. For example, here is Tasmania with its SUAs, where it is easy to see that each SUA is reasonably well-defined. (The colours represent the 2011 Census populations of each SUA).

TAS

On the other hand, here is New South Wales and the area around Sydney. Given the near continuous spreading “band” around Sydney, the definition of a “city”, “city boundaries”, or “city limits” now becomes harder, both from the size (population and density) perspective, as well as the socio-economic connectedness perspective. For example, do we consider Wollongong (just south of Sydney) as part of the same urban system (with Sydney), or a separate urban system?

SYD

Similarly, here is Victoria and the area around Melbourne, and one can see a similar type of SUA distribution, with strong spatial dependence between SUAs around Melbourne.

MEL

This geographical question is an important one for economic and planning analysis and also has important policy implications. Considering a regional/national perspective, what is a “city”? To further complicate matters, functional or statistically derived definitions often do not correspond with administrative-historical divisions and while the socio-economic processes are better understood (or at least with more scientific integrity) with functional definitions, political and policy decision making often happens at the administrative-historical level of definitions. With the differing geography of these two definitions, how should a scientific understanding at the functional level be enacted into socio-political decision-making at the administrative level?

Spatial stories from around the world: 1

This report, amongst many similar ones, talks about the existence of many cities superposed in a single city, layer over layer. If there are spatial layers signalling extreme inequality that exist side by side and over each other, there must be the people layers too: layers of super rich and super poor existing side by side and over each other.

While this unacceptable situation draws much attention, the overwhelming reaction it draws is human: the plight of millions needing help and support, the plight of the unsustainable city, the plight of injustice.

There is, however, an economic question that should be asked: the layer most seen and most neglected is the layer that provides massive amounts of informal services to the city too. What are the economic (and sustainability) returns of the removal of trash and recycling in Brazil, or those of the millions of shopkeepers, farmers, construction workers, taxi drivers, street vendors, rag pickers, tailors, and repairmen in Dharavi Mumbai? The statistics and distribution of space and density in which these economic activities are carried out makes one think of the ratio of the amount of spatial and economic resources consumed per capital to the economic output that is produced.

Then, provision of a decent standard of housing for millions of people would not remain a question of provision, it would turn into the same policy idea that now says: if you invest a lot in big business, the benefits trickle down to the millions. Maybe we should formally compute the economic returns from millions of people in terms of the services they provide, and think of a policy perspective that says: invest in the smallest of businesses and decent living, education, and health environments for millions, since the economic benefits of these services trickle down as well as up to all the inhabitants of the city. Because even without the computations, it is perhaps clear, that the benefits of the super big are not trickling down to the informal and often largest parts of the city.

Does income inequality scale with city size?

Cities are strange creatures. They are neither fully designed, nor fully self-organised. Their spatial production is partly controlled by central forces of urban planning, architecture, and technology, and partly by decentralised social, economic, political and technological processes enacted by millions of inhabitants. So, one is tempted to say, they are part complex engineered products, part biological organism.

The two important scientific questions lying at opposite ends of the spectrum are: (a) what makes a city similar to all other cities in the world, and (b) what gives a city its own unique identity? The first question is the search for universal laws. The second one, the search for explanations of diversity and heterogeneity. One could agree that the New York and Mumbai metropolitan regions, both roughly having populations around the 20 million mark, are definitive economic hubs for their nations, respectively. But, to what extent could we claim similarity, and to what extent difference? Both questions would need to be answered, before we can formulate and solve for the laws of cities.

Recent research from the Santa Fe Institute has started to provide insight into the first question. This paper has shown that many diverse properties of cities, from economic productivity and innovation potential, to lengths of infrastructure networks, follow universal scaling laws when measured against city population size. Put simply, the population of a city is a good indicator for several of its behaviours. It was found that all material resources (such as infrastructure and road networks) showed economies of scale and scaled sub-linearly with population size. On the other hand, most social and economic indicators (such as incomes, wealth, patents, crime) showed increasing returns and scaled super-linearly with population size. This leads to the postulated theory behind the existence of cities: urban agglomerations exist because it is inherently advantageous for them to exist. As population grows, the per capita expenditure on maintaining the urban system is less than the per capita socio-economic returns by way of income generation and wealth (although negative aspects such as crime grow super-linearly too).

These findings imply that larger cities are somehow more advantageous, since the larger the size of the urban system, the larger the production of wealth and innovation, and smaller the investment to sustain the system. However, what is also well known is that total wealth and income and the distribution of this wealth and income are two totally separate things. Bigger cities are certainly more wealthy, but do they make all inhabitants proportionately more wealthy too?

At the Sydney Urban Lab we studied scaling of per capita incomes for separate census defined income categories against population size for the whole of Australia. Read our paper here.

Across several urban area definitions, we find that lowest incomes grow just linearly or sub-linearly, whereas highest incomes grow super-linearly, with total income just super-linear. These findings support the earlier Santa Fe finding: the bigger the city, the richer the city, though the (just) super-linear scaling of total income was more consistent with the findings here. But, most importantly, we see an emergent metric of inequality: the larger the population size and densities of a city, higher incomes grow more quickly than lower, suggesting a disproportionate agglomeration of incomes in the highest income categories in big cities. Put simply, if you had low income, you are as likely to be found in a small city as in a big city. But, your costs of living in a bigger city would be higher, making you relatively poorer in a bigger city for the same income. But, if you had the highest incomes, you would be much more likely to be found in a much larger city. For you also the costs of living would certainly be higher, but it remains for future research to uncover the relative advantage you can gain by being able to afford better things in a bigger city on a higher income, e.g. education and private health services, and how this compares with the relative ratios of what can be afforded on lower incomes. Future research will also need to uncover the relationships of these findings to the indices of inequality measurement.

Because there are many more people on lower incomes that scale sub-linearly as compared to the highest that scale super-linearly, these findings suggest a scaling of inequality: the larger the population, the greater the inequality. Urban and economic planning will need to examine ways in which larger cities can be made more equitable.

Figure1

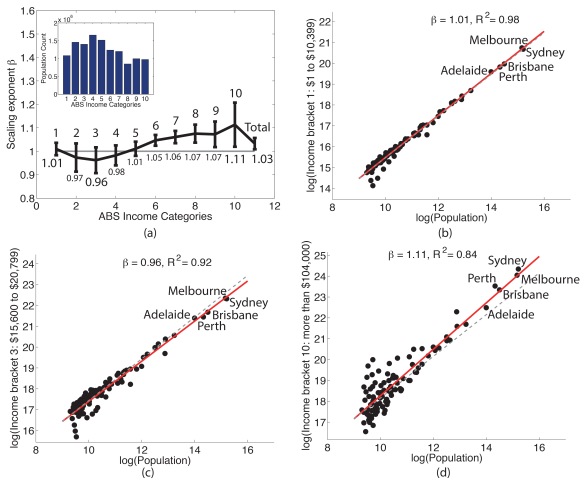
Figure 1. Scaling of income in all 101 Significant Urban Areas (SUAs) in Australia. (a) Scaling exponents with 95% CI in 10 Australian Bureau of Statistics (ABS) income categories. (b-d) Scaling behaviour for income categories 1, 3, and 10, (roughly categorised as lowest, middle lower, and highest, respectively), showing linear to sub-linear behaviours in the lower income categories, with super-linear behaviour emerging for higher income categories.

Figure2

Figure 2. Scaling of income in high population density SUAs. (a) Log-log plot of population count versus population density for all 101 SUAs shows the general positive correlation of higher population with higher density. Sizes of circles scaled corresponding to total population counts. (b) Plot of population count against population density shows some outliers. E.g. High population, lower densities, or low populations with higher densities. The cut-off point for excluding all SUAs where both population counts as well as population densities are low occurs at around 152 persons per sq km. (Bathurst). (c) Scaling exponents with 95% CI in 10 ABS income categories for the top 66 highest density and population count SUAs. (d-g) Scaling behaviour for income categories 1, 3, 4, and 10, (roughly categorised as lowest, middle lower, and highest, respectively), showing linear to sub-linear behaviours in the lower income categories, with super-linear behaviour emerging for higher income categories for the 66 high population and high density SUAs.

Figure3

Figure 3. Scaling of income in SUAs by population count cut-offs. Scaling exponents with 95% CI in 10 ABS income categories for SUAs over (a) 30 000 total population, (b) 40 000 population, and (c) 80 000 population, showing linear to sub-linear behaviours in the lower income categories, with super-linear behaviour emerging for higher income categories.

What is this blog about?

In 2014, the estimated urban population of the planet was about 54%. The trend of the world turning more and more urban is on the rise.

In 2014, important books like Inequality: What can be done? and Capital in the 21st Century note that the world is also becoming more and more unequal.

Is there a relationship between the sizes of cities, the sizes of their populations, and trends of inequality? Are the world’s urban spaces more unequal than rural or regional places?

Perhaps surprisingly, while inequality of wealth and income is now at the forefront of research in many disciplines, the spatial angle of inequality is less understood or talked about. First and foremost, cities are spatial agglomerations, dense concentrations that signal that somehow people choose (or, in some cases, are forced to) live in tight structures of networked interactions. How can social and economic processes of interaction, embedded and constrained by space, produce inequality? What are the spatial aspects of the manifestation of inequality? Can space be a driver of inequality?

This blog is about sharing thoughts on these questions. This blog is also about methods of measurement, detection, and interpretations, and new forms of data providing new types of insights on cities, their structures and dynamics.